See how BeZero's ratings are driving credit prices in Fastmarkets' latest report → Read the analysis

  • BeZero Carbon Homepage
  • Ratings
    • Approach
    • Geospatial
    • Resources
    • Listings
    • Developers
  • Products
    • Offer
    • Testimonials
  • Research
  • Insights
  • About
    • Company
    • Leadership
    • Science
    • Governance
  • Log in

Work

  • Careers

Social

  • Twitter (X)
  • LinkedIn
  • YouTube
Registered company #12577887

Contact

  • contact@bezerocarbon.com

Press

  • press@bezerocarbon.com

Legal

  • Disclaimer
  • Cookies
  • Privacy Policy
  • Terms of use

Visit

25 Christopher Street London EC2A 2BS

Geospatial analysis

Geospatial analysis

Assess carbon projects, inside and outside the project area, before, during and after project activities.

  • Approach
  • Geospatial
  • Resources
  • Listings
  • Developers

Applied geospatial analysis

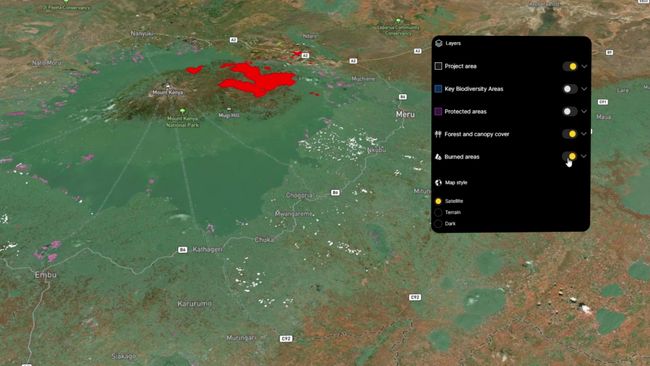
Using carbon maps informed by spaceborne and airborne LiDAR, radar and multispectral imagery.

Validating maps in context with the most geographically extensive ground truth database for forest carbon.

Building targeted machine learning models to track ecosystem change, project effectiveness, and natural hazards in near real-time.

Satellite image of Earth. How does geospatial analysis support carbon ratings?
  • Project boundaries
  • Carbon stocks
  • Change detection
  • Causal analysis
  • Natural hazards

See where projects are located and understand their local context with hundreds of audited and reconstructed project boundaries.

Explore how we use geospatial analysis
Project boundaries shown on a 3D imageCarbon stocks shown over a 3D image of an area of landBaseline change shown ove a 3D image of an area of landBaseline dynamic base shown over a 3D image of an area of landNatural hazards shown over a 3D image of an area of land

Interactive tools

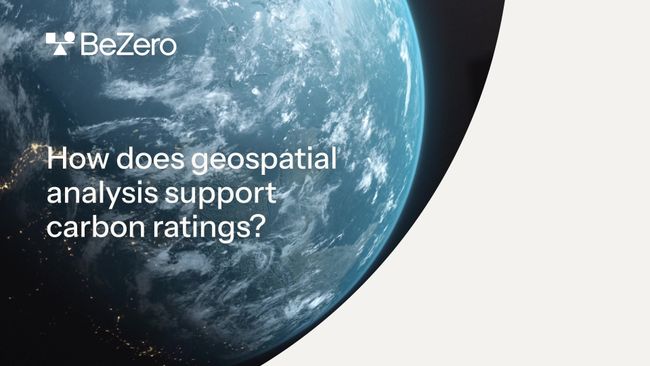
Assess carbon quality using interactive features on our platform:

  • Explore project boundaries to understand local context.

  • Monitor year on year forest cover and loss.

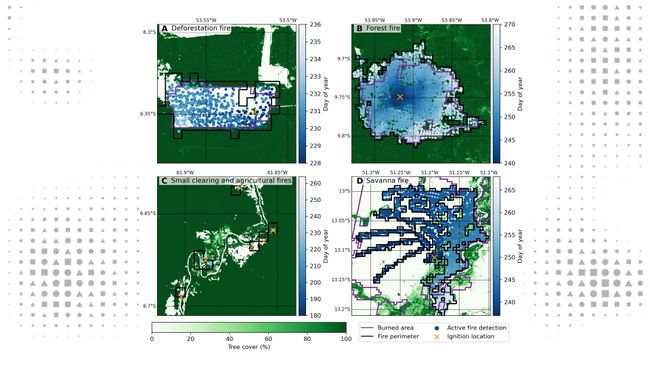
  • See active fire detections and burned areas with maps and charts.

  • Assess changes in aboveground carbon stocks.

  • Visualise how terrain affects project performance in 3D.

  • Understand the impact of drought, sea level rise, pests and disease.

Applied analysis

Unique satellite data

Fusion of active and passive sensor data, from space agencies and commercial partners, providing near real-time monitoring of project regions.
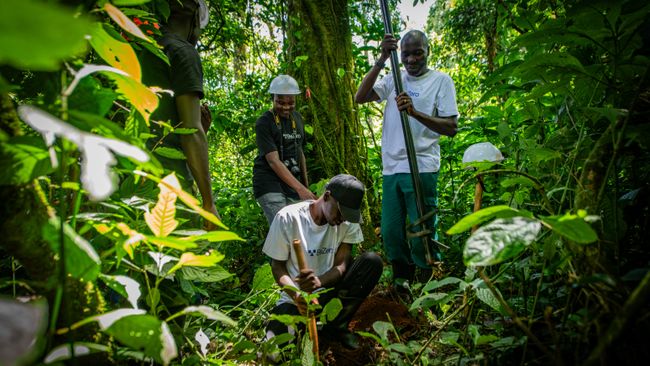
  • ESAESA
  • KayrrosKayrros
  • NASANASA
  • PlanetPlanet

Local specialists

Working with local partners to provide critical ground truth spanning thousands of sites globally, the most extensive forest carbon dataset in the market.

  • INPEINPE
  • IPAMIPAM
  • MakerereMakerere
  • UBCUBC
Uganda field trip team building field plots

Hazard detection

In-house remote sensing and near real-time monitoring detect, assess and predict fire hazards and carbon loss.

  • ESAESA
  • KNMIKNMI
  • NasaNasa
  • TUNTUN

Partners and providers

  • NASANASA
  • ESAESA
  • PlanetPlanet
  • KayrrosKayrros
  • INPEINPE
  • IPAMIPAM
  • TUTU
  • KNMIKNMI
  • IBATIBAT
  • MAXARMAXAR
  • ECMWFECMWF
  • UKRIUKRI
  • JAXAJAXA
  • UBCUBC
  • UEAUEA
  • UWAUWA
  • MakerereMakerere
  • University of York University of York
  • AirbusAirbus
  • ASLASL
  • EmbrapaEmbrapa
Next in ratings - resourcesNext in ratings - resources

See our ratings methodology and frameworks

Learn how we rate projects with our methodologies, sub-sector frameworks and processes.

  • Products

    Access the complete carbon risk toolkit, for every stage of the project life cycle.

  • Research

    Explore cutting edge research into what’s needed to deliver effective environmental markets.